- Home ›
- JpGraphを使ったグラフの描画 ›
- JpGraphの使い方 ›
- HERE
外枠に影をつける
広告
グラフの外枠を表示した際に、外枠に対して影をつけることが出来ます。影をつけるにはGraphクラスで用意されている「SetShadow」メソッドを使います。
SetShadow
function SetShadow($aShowShadow,$aShadowWidth,$aShadowColor)
Add a drop shadow to the image

Parameter:
  $aShowShadow  True=add a drop shadow(Default true)
  $aShadowWidth  Width (in pixels of shadow)(Default 5)
  $aShadowColor  Shadow color(Default array(102,102,102))
1番目の引数で影を付けるかどうかを指定します。影を付ける場合は「true」を指定します。デフォルトの値も「true」です。
2番目の引数で影の幅をピクセル単位で指定します。デフォルトの幅は「5」です。
3番目の引数で影の色を指定します。デフォルトの幅は「array(102,102,102)」です。色の指定方法については『JpGraphにおける色の指定方法』を参照して下さい。
例えば次のように指定します。
include ("jpgraph/jpgraph.php");

$graph = new Graph(250, 200);
$graph->SetShadow();

$graph->Stroke();
サンプル
それでは実際に試してみます。
<?php

include ("jpgraph/jpgraph.php");
include ("jpgraph/jpgraph_bar.php");

$data1y = array(-8, 8, 9, 3, 5, 6);
$data2y = array(18, 2, 1, 7, 5, 4);

$graph = new Graph(250, 200, "auto");
$graph->SetFrame(true);
$graph->SetScale("textlin");
$graph->SetShadow();

$graph->img->SetMargin(40, 30, 20, 40);

$b1plot = new BarPlot($data1y);
$b1plot->SetFillColor("orange");
$b1plot->value->Show();
$b2plot = new BarPlot($data2y);
$b2plot->SetFillColor("blue");
$b2plot->value->Show();

$gbplot = new AccBarPlot(array($b1plot, $b2plot));

$graph->Add($gbplot);

$graph->Stroke();
?>
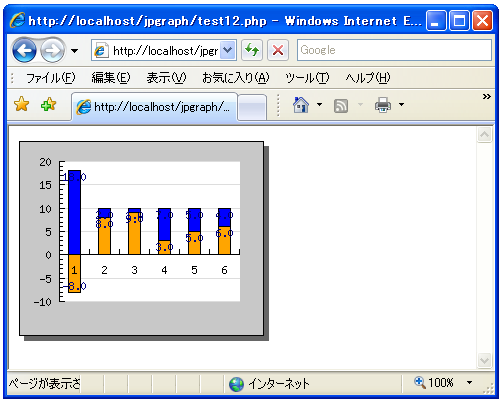
上記のPHPファイルをブラウザで開いてみます。ブラウザには次のように表示されます。
( Written by Tatsuo Ikura )