- Home ›
- JpGraphを使ったグラフの描画 ›
- 棒グラフ(BarPlot) ›
- HERE
棒グラフの色をグラデーションにする
広告
棒グラフの内部の色にはグラデーションを指定することが出来ます。指定するにはBarPlotクラスで用意されている「SetFillGradient」メソッドを使います。
SetFillGradient
function SetFillGradient($from_color,$to_color,$style)
Specify a gradient fill for the bars.

Parameter:
  $from_color  Start color
  $to_color  End color
  $style  Type of gradient
1番目と2番目の引数でグラデーションさせる2つの色を指定します。色の指定方法は『JpGraphにおける色の指定方法』を参照して下さい。
3番目の引数でグラデーションスタイルを指定します。指定可能なスタイルは次の通りです。
| 設定値 | スタイル |
|---|---|
| GRAD_VER | Vertical gradient |
| GRAD_HOR | Horizontal gradient |
| GRAD_MIDHOR | From the center and out, horizontal |
| GRAD_MIDVER | From the center and out, vertical |
| GRAD_WIDE_MIDVER | From the center and out, vertical. Wide mid section |
| GRAD_WIDE_MIDHOR | From the center and out, horizontal. Wide mid section |
| GRAD_CENTER | From the center and beaming out |
| GRAD_LEFT_REFLECTION | Simulates a reflection on the left side |
| GRAD_RIGHT_REFLECTION | Simulates a reflection on the right side |
| GRAD_RAISED_PANEL | Raised panel with shadow |
例えば次のように記述します。
$ydata1 = array(10, 4, 7, 9, 2, 3);

$barplot1 = new BarPlot($ydata1);

$barplot1->SetFillGradient("orange", "darkred", GRAD_VER);
サンプル
それでは実際に試して見ます。
<?php

include ("jpgraph/jpgraph.php");
include ("jpgraph/jpgraph_bar.php");

$graph = new Graph(250, 200, "auto");
$graph->SetFrame(true);
$graph->SetScale("textlin");

$graph->img->SetMargin(30, 30, 30, 30);

$ydata = array(10, 4, 7, 9, 1, 3);

$barplot = new BarPlot($ydata);
$barplot->SetWidth(0.8);
$barplot->SetFillGradient("orange", "darkred", GRAD_VER);

$graph->Add($barplot);

$graph->Stroke();
?>
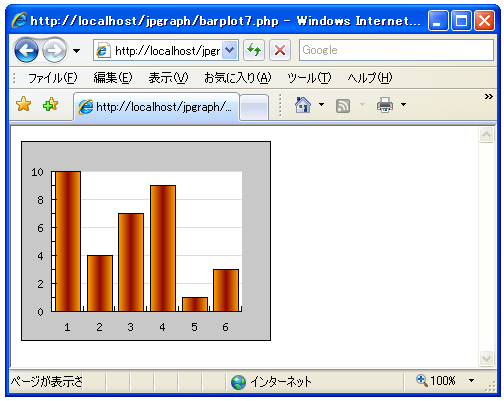
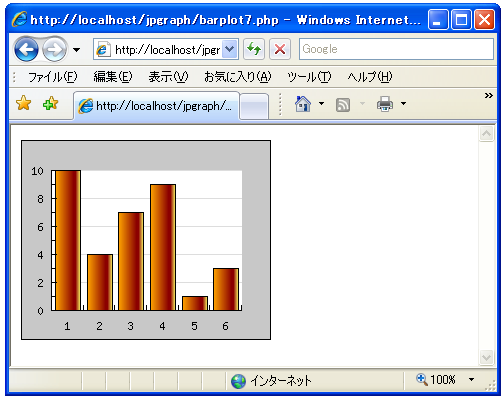
上記のPHPファイルをブラウザで開いてみます。ブラウザには次のように表示されます。
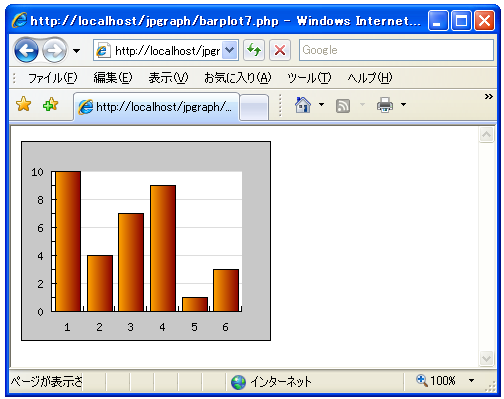
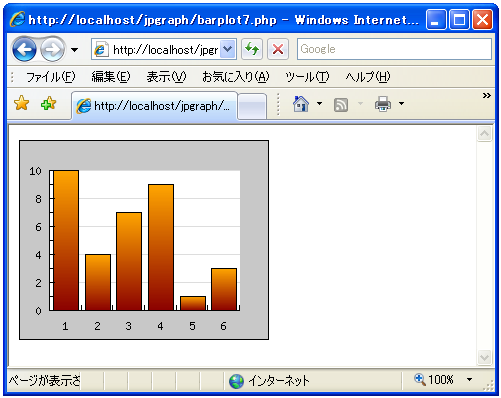
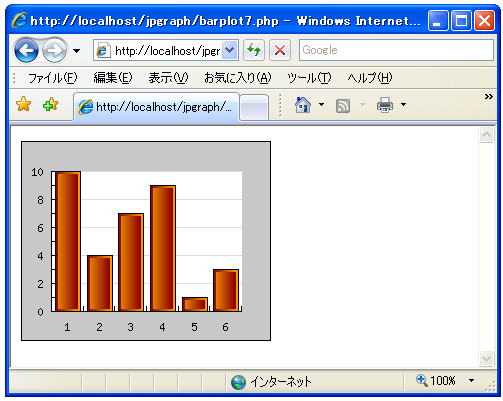
先ほどのサンプルはグラデーションスタイルが「GRAD_VER」の場合ですが、それ以外のスタイルも試してみます。先ほどのサンプルでスタイルの部分だけを変更して実行した結果は次の通りです。
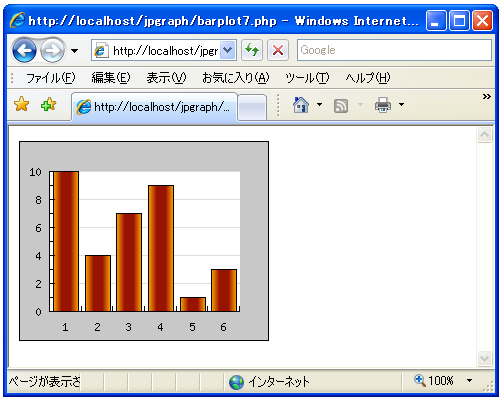
GRAD_HOR:
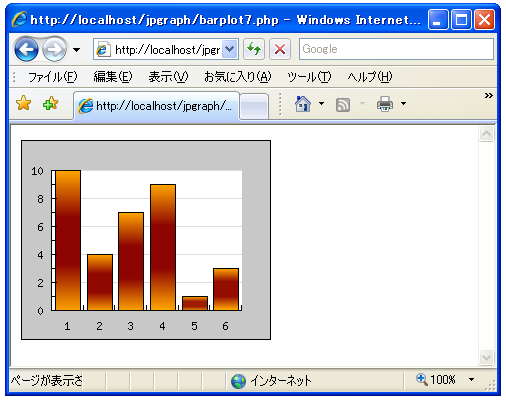
GRAD_MIDHOR:
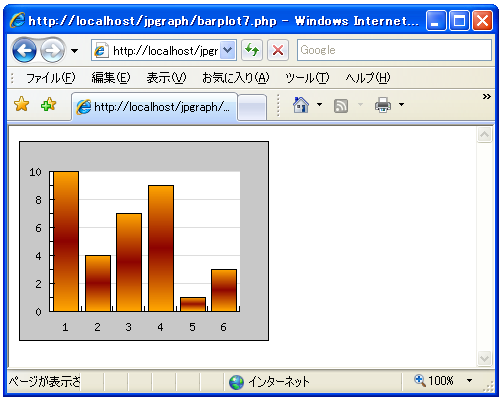
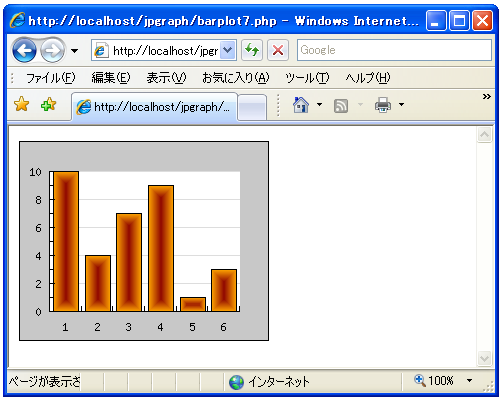
GRAD_MIDVER:
GRAD_WIDE_MIDVER:
GRAD_WIDE_MIDHOR:
GRAD_CENTER:
GRAD_LEFT_REFLECTION:

GRAD_RIGHT_REFLECTION:
GRAD_RAISED_PANEL:
( Written by Tatsuo Ikura )