- Home ›
- JpGraphを使ったグラフの描画 ›
- 棒グラフ(BarPlot) ›
- HERE
棒グラフの色の設定
広告
棒グラフの色の設定を行います。棒グラフの輪郭の色を設定するにはBarPlotクラスの親クラスであるPlotクラスで用意されている「SetColor」メソッドを使います。
SetColor
function SetColor($aColor)
Specify color for plot.

Parameter:
  $aColor  Color
引数で棒の輪郭の色を指定します。色の指定方法はキーワードでの指定やRGB形式、16進数を使った指定方法などがあります。詳しくは『JpGraphにおける色の指定方法』を参照して下さい。
実際に試してみるとRGBを配列で指定する方式での色指定は使えませんでした。キーワードか16進数で色を指定して下さい。
また棒グラフの内部の色を設定するにはBarPlotクラスで用意されている「SetFillColor」メソッドを使います。
SetFillColor
function SetFillColor($aColor)
Specify fill color for bars.

Parameter:
  $aColor  Color specification
引数で棒の内部の色を指定します。色の指定方法は先ほどと同じです。
複数の棒グラフを表示している場合でも元になっているそれぞれの棒グラフに対して色を設定して下さい。GroupBarPlotクラスのオブジェクトに対して色を設定しても無視されます。
例えば次のような記述となります。
$ydata1 = array(10, 4, 7, 9, 2, 3);
$ydata2 = array(5, 12, 3, 8, 5, 9);

$barplot1 = new BarPlot($ydata1);
$barplot2 = new BarPlot($ydata2);

$barplot1->SetColor("red");
$barplot1->SetFillColor("orange");
$barplot2->SetColor("black");
$barplot2->SetFillColor("white");

$groupbarplot = new GroupBarPlot(array($barplot1,$barplot2));

$graph = new Graph(250, 200);

$graph->Add($groupbarplot);
サンプル
それでは実際に試して見ます。
<?php

include ("jpgraph/jpgraph.php");
include ("jpgraph/jpgraph_bar.php");

$graph = new Graph(250, 200, "auto");
$graph->SetFrame(true);
$graph->SetScale("textlin");

$graph->img->SetMargin(30, 30, 30, 30);

$ydata1 = array(10, 4, 7, 9, 1, 3);
$ydata2 = array(5, 12, 3, 8, 5, 9);

$barplot1 = new BarPlot($ydata1);
$barplot2 = new BarPlot($ydata2);

$barplot1->SetColor("red");
$barplot1->SetFillColor("yellow");
$barplot2->SetFillColor("#337112");

$groupbarplot = new GroupBarPlot(array($barplot1,$barplot2));

$graph->Add($groupbarplot);

$graph->Stroke();
?>
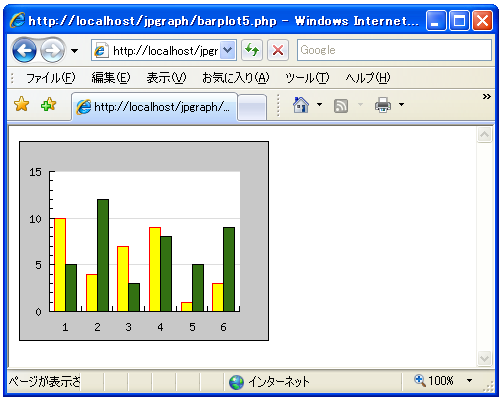
上記のPHPファイルをブラウザで開いてみます。ブラウザには次のように表示されます。
( Written by Tatsuo Ikura )