- Home ›
- JpGraphを使ったグラフの描画 ›
- 棒グラフ(BarPlot) ›
- HERE
BarPlotクラス
広告
ここでは棒グラフを描画する方法を確認していきます。棒グラフを作成するにはBarPlotクラスのオブジェクトを作成しGraphクラスのオブジェクトに追加します。
CLASS BarPlot EXTENDS Plot
BarPlotクラスはPlotクラスのサブクラスです。またBarPlotクラスは「jpgraph_bar.php」内で定義されていますのでまずこのファイルを読み込む必要があります。
include ("jpgraph/jpgraph.php");
include ("jpgraph/jpgraph_bar.php");
BarPlotクラスのコンストラクタは次のように定義されています。
BarPlot
function BarPlot(&$datay,$datax)
Create a new bar plot

Parameter:
  &$datay  Data serie
  $datax  X-positions(Default false)
1番目の引数にY軸の値を表すデータを配列で指定します。
例として{10, 4, 7, 9, 2, 3}と言う6つのデータを持つ棒グラフを作成するには次のように記述します。
include ("jpgraph/jpgraph.php");
include ("jpgraph/jpgraph_bar.php");

$ydata = array(10, 4, 7, 9, 2, 3);
$barplot = new BarPlot($ydata);

$graph = new Graph(250, 200);

$graph->Add($barplot);
作成した棒グラフをグラフとして追加するには「Add」メソッドを使います。詳しくは『指定したグラフを表示する』を参照して下さい。
サンプル
それでは実際に試して見ます。
<?php
include ("jpgraph/jpgraph.php");
include ("jpgraph/jpgraph_bar.php");
$graph = new Graph(250, 200, "auto");
$graph->SetFrame(true);
$graph->SetScale("textlin");
$graph->img->SetMargin(30, 30, 30, 30);
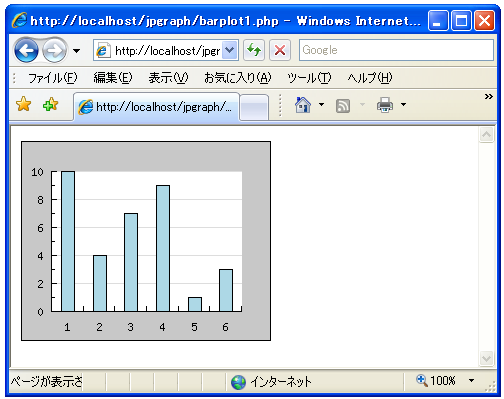
$ydata = array(10, 4, 7, 9, 1, 3);
$barplot = new BarPlot($ydata);
$graph->Add($barplot);
$graph->Stroke();
?>
上記のPHPファイルをブラウザで開いてみます。ブラウザには次のように表示されます。
( Written by Tatsuo Ikura )