- Home ›
- JpGraphを使ったグラフの描画 ›
- JpGraphの使い方 ›
- HERE
軸の太さの設定
広告
グラフの軸の太さを設定します。太さを設定するにはAxisクラスで用意されている「SetWeight」メソッドを使います。
SetWeight
function SetWeight($aWeight)
Weight of axis

Parameter:
  $aWeight  Weight in pixels
引数に軸の太さをピクセル単位で指定します。
例えば次のように指定します。
include ("jpgraph/jpgraph.php");

$graph = new Graph(250, 200);

$graph->xaxis->SetWeight(3);

$graph->Stroke();
サンプル
それでは実際に試してみます。
<?php

include ("jpgraph/jpgraph.php");
include ("jpgraph/jpgraph_bar.php");

$data1y=array(-8,8,9,3,5,6);
$data2y=array(18,2,1,7,5,4);

$graph = new Graph(250,200,"auto");
$graph->SetFrame(true);
$graph->SetScale("textlin");

$graph->title->Set("Title");

$graph->xaxis->SetWeight(2);
$graph->yaxis->SetWeight(5);

$graph->img->SetMargin(50,30,30,30);

$b1plot = new BarPlot($data1y);
$b1plot->SetFillColor("orange");
$b1plot->value->Show();
$b2plot = new BarPlot($data2y);
$b2plot->SetFillColor("blue");
$b2plot->value->Show();

$gbplot = new AccBarPlot(array($b1plot,$b2plot));

$graph->Add($gbplot);

$graph->Stroke();
?>
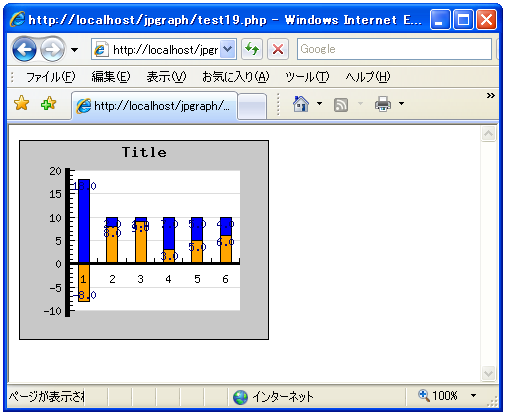
上記のPHPファイルをブラウザで開いてみます。ブラウザには次のように表示されます。
( Written by Tatsuo Ikura )