- Home ›
- JpGraphを使ったグラフの描画 ›
- 線グラフ(LinePlot) ›
- HERE
凡例を表示する
広告
線グラフに凡例を表示させてみます。凡例を表示するにはLinePlotクラスの親クラスであるPlotクラスで用意されている「SetLegend」メソッドを使います。
SetLegend
function SetLegend($aLegend,$aCSIM,$aCSIMAlt)
Set legend string for this plot

Parameter:
  $aLegend  Legend string
  $aCSIM  URL for image map(Default "")
  $aCSIMAlt  Alt text for image map(Default "")
1番目の引数に凡例として表示したい文字列を指定します。2番目と3番目の引数はイメージマップを使う場合に利用しますのでここでは省略します。
凡例はデフォルトで右上に表示されます。また凡例には対象となる線グラフの線の色やスタイルなどの情報が自動的に表示されますので2つ以上の線グラフの凡例を追加する場合でも凡例の文字列だけを指定すれば区別は付くようになっています。
※凡例に関する詳細な設定については『凡例(Legend)の詳細設定』を参照して下さい。
実際には次のような記述となります。
$ydata1 = array(10, 4, 7, 9, 2, 3);

$lineplot1 = new LinePlot($ydata1);
$lineplot1->SetLegend("Sample");

$graph = new Graph(250, 200);

$graph->Add($lineplot1);
サンプル
それでは実際に試して見ます。
<?php
include ("jpgraph/jpgraph.php");
include ("jpgraph/jpgraph_line.php");
$graph = new Graph(300, 200, "auto");
$graph->SetFrame(true);
$graph->SetScale("textlin");
$graph->img->SetMargin(40, 40, 30, 30);
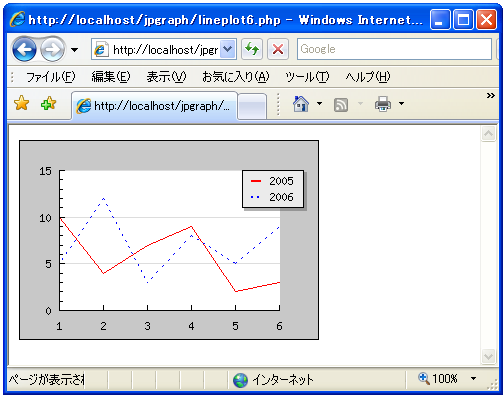
$ydata1 = array(10, 4, 7, 9, 2, 3);
$ydata2 = array(5, 12, 3, 8, 5, 9);
$lineplot1 = new LinePlot($ydata1);
$lineplot1->SetColor(array(255, 0, 0));
$lineplot2 = new LinePlot($ydata2);
$lineplot2->SetColor(array(0, 0, 255));
$lineplot2->SetStyle("dashed");
$lineplot1->SetLegend("2005");
$lineplot2->SetLegend("2006");
$graph->Add($lineplot1);
$graph->Add($lineplot2);
$graph->Stroke();
?>
上記のPHPファイルをブラウザで開いてみます。ブラウザには次のように表示されます。
( Written by Tatsuo Ikura )