- Home ›
- JpGraphを使ったグラフの描画 ›
- JpGraphの使い方 ›
- HERE
目盛の設定
グラフの目盛の設定を行います。設定にはGraphクラスで用意されている「SetScale」メソッドを使います。
SetScale
function SetScale($aAxisType,$aYMin,$aYMax,$aXMin,$aXMax)
Specify scale to use for X and Y axis

Parameter:
  $aAxisType  Type of axis
  $aYMin  Y-min(Default 1)
  $aYMax  Y-max(Default 1)
  $aXMin  X-min(Default 1)
  $aXMax  X-max(Default 1)
1番目の引数でX軸およびY軸の目盛りの表示方式を設定します。設定できる値は次の通りです。
| 設定値 | 説明 |
|---|---|
| lin | Linear scale. Both X and Y axis |
| log | Logarithmic scale. Both X and Y axis |
| text | Text scale. Only on X axis |
| int | Integer scale. X and Y axis |
X軸として設定出来る値は「lin」「text」「log」「int」のいずれか、Y軸として設定できるのは「lin」「log」「int」のいずれかの値です。例えばX軸に「text」Y軸に「int」とする場合はX軸の設定値とY軸の設定値を続けて記述し「textint」のように記述します。
例えば次のように指定します。
include ("jpgraph/jpgraph.php");

$graph = new Graph(250,200);
$graph->SetScale("textint");

$graph->Stroke();
それぞれの意味ですが正確な使い方がはっきりと分からないのですが「text」にした場合には項目毎に1つずつ値が表示されます。「int」と「lin」の場合には数値刻みで目盛りが表示されます。「lin」の方が細かい目盛りが表示されます。「log」の場合は対数目盛となります。
通常はX軸には項目名となるため「text」を、Y軸は数値の値を示す目盛りとなりますので「int」または「lin」を使います。
サンプル
それでは実際に試してみます。まず「textlin」を設定してみましょう。
<?php

include ("jpgraph/jpgraph.php");
include ("jpgraph/jpgraph_bar.php");

$data1y = array(-8, 8, 9, 3, 5, 6);
$data2y = array(18, 2, 1, 7, 5, 4);

$graph = new Graph(250, 200, "auto");
$graph->SetFrame(true);
$graph->SetScale("textlin");

$graph->img->SetMargin(40, 30, 20, 40);

$b1plot = new BarPlot($data1y);
$b1plot->SetFillColor("orange");
$b1plot->value->Show();
$b2plot = new BarPlot($data2y);
$b2plot->SetFillColor("blue");
$b2plot->value->Show();

$gbplot = new AccBarPlot(array($b1plot, $b2plot));

$graph->Add($gbplot);

$graph->Stroke();
?>
上記のPHPファイルをブラウザで開いてみます。ブラウザには次のように表示されます。
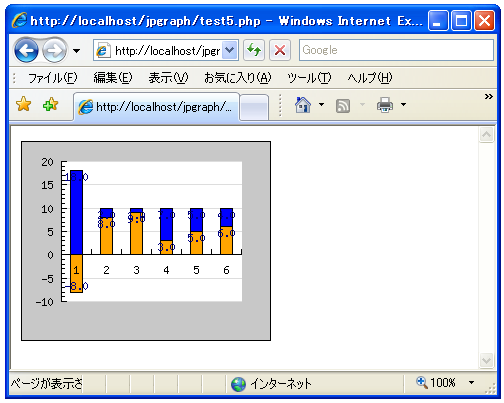
次は「textint」を設定してみます。
<?php

include ("jpgraph/jpgraph.php");
include ("jpgraph/jpgraph_bar.php");

$data1y = array(-8, 8, 9, 3, 5, 6);
$data2y = array(18, 2, 1, 7, 5, 4);

$graph = new Graph(250, 200, "auto");
$graph->SetFrame(true);
$graph->SetScale("textint");

$graph->img->SetMargin(40, 30, 20, 40);

$b1plot = new BarPlot($data1y);
$b1plot->SetFillColor("orange");
$b1plot->value->Show();
$b2plot = new BarPlot($data2y);
$b2plot->SetFillColor("blue");
$b2plot->value->Show();

$gbplot = new AccBarPlot(array($b1plot, $b2plot));

$graph->Add($gbplot);

$graph->Stroke();
?>
上記のPHPファイルをブラウザで開いてみます。ブラウザには次のように表示されます。

Y軸の目盛りが先ほどと違っているのが確認できます。
目盛りの最小値と最大値の設定
「SetScale」メソッドの2番目から5番目の引数で目盛りの最小値や最大値を設定します。例えばY軸の最小値を「-10」最大値を「20」とする場合には次のように記述します。
include ("jpgraph/jpgraph.php");

$graph = new Graph(250,200);
$graph->SetScale("textint", -10, 20);

$graph->Stroke();
それでは実際に試してみます。下記ではY軸の目盛りを最小値「-20」最大値「30」に設定しています。
<?php

include ("jpgraph/jpgraph.php");
include ("jpgraph/jpgraph_bar.php");

$data1y = array(-8, 8, 9, 3, 5, 6);
$data2y = array(18, 2, 1, 7, 5, 4);

$graph = new Graph(250, 200, "auto");
$graph->SetFrame(true);
$graph->SetScale("textlin", -20, 30);

$graph->img->SetMargin(40, 30, 20, 40);

$b1plot = new BarPlot($data1y);
$b1plot->SetFillColor("orange");
$b1plot->value->Show();
$b2plot = new BarPlot($data2y);
$b2plot->SetFillColor("blue");
$b2plot->value->Show();

$gbplot = new AccBarPlot(array($b1plot, $b2plot));

$graph->Add($gbplot);

$graph->Stroke();
?>
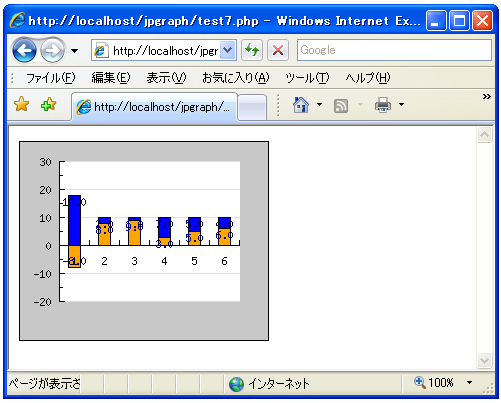
上記のPHPファイルをブラウザで開いてみます。ブラウザには次のように表示されます。
( Written by Tatsuo Ikura )