- Home ›
- JpGraphを使ったグラフの描画 ›
- JpGraphの使い方 ›
- HERE
軸のタイトルの設定
広告
軸のタイトルの設定を行います。軸のタイトルはAxisクラスのオブジェクトから「title」プロパティを使ってオブジェクトを取得しそのオブジェクトに対して設定を行います。
「title」プロパティで取得したオブジェクトは「Text」クラスのオブジェクトになります。この「Text」クラスはグラフのタイトルを設定する際に取得したオブジェクトのクラスと同じ「Text」クラスです。
タイトルの文字列を設定するにはTextクラスで定義されている「Set」メソッドを使います。
Set
function Set($aTxt)
Set text to be displayed

Parameter:
  $aTxt  Text string
引数にタイトルとして表示する文字列を設定します。
例えば次のように指定します。
include ("jpgraph/jpgraph.php");

$graph = new Graph(250,200);
$graph->xaxis->title->Set("x-title");
$graph->yaxis->title->Set("y-title");

$graph->Stroke();
サンプル
それでは実際に試してみます。
<?php

include ("jpgraph/jpgraph.php");
include ("jpgraph/jpgraph_bar.php");

$data1y = array(-8, 8, 9, 3, 5, 6);
$data2y = array(18, 2, 1, 7, 5, 4);

$graph = new Graph(250, 200, "auto");
$graph->SetFrame(true);
$graph->SetScale("textlin");
$graph->title->Set("Title");
$graph->xaxis->title->Set("x-title");
$graph->yaxis->title->Set("y-title");

$graph->img->SetMargin(40, 30, 20, 40);

$b1plot = new BarPlot($data1y);
$b1plot->SetFillColor("orange");
$b1plot->value->Show();
$b2plot = new BarPlot($data2y);
$b2plot->SetFillColor("blue");
$b2plot->value->Show();

$gbplot = new AccBarPlot(array($b1plot, $b2plot));

$graph->Add($gbplot);

$graph->Stroke();
?>
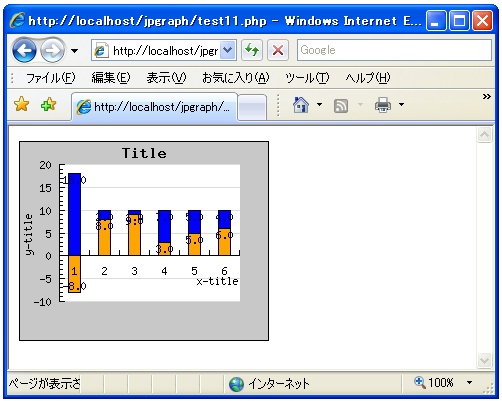
上記のPHPファイルをブラウザで開いてみます。ブラウザには次のように表示されます。
( Written by Tatsuo Ikura )