- Home ›
- JpGraphを使ったグラフの描画 ›
- 棒グラフ(BarPlot) ›
- HERE
棒グラフの色を指定した順に切り替える
広告
棒グラフでは元になったデータの数だけ棒が描かれます。色を設定すれば同じ棒グラフであれば同じ色になりますが、棒を描く毎に色(内部の色)を変えるように設定することも可能です。
使用するメソッドは前回と同じ「SetFillColor」メソッドですが、引数で色を指定する時に色の代わりに色の配列を指定します。
$ydata1 = array(10, 4, 7, 9, 2, 3);

$barplot1 = new BarPlot($ydata1);

$barplot1->SetFillColor(array("red", "green"));
上記のように設定した場合、棒の内部の色を最初の棒は「red」、次の棒は「green」、その次はまた「red」と配列で指定した色を順に適用していきます。
$ydata1 = array(10, 4, 7, 9, 2, 3);

$barplot1 = new BarPlot($ydata1);

$barplot1->SetFillColor(array("red", "green", "blue"));
上記であれば「red」>「green」>「blue」>「red」>「green」と順に色が適用されていきます。
サンプル
それでは実際に試して見ます。
<?php
include ("jpgraph/jpgraph.php");
include ("jpgraph/jpgraph_bar.php");
$graph = new Graph(250, 200, "auto");
$graph->SetFrame(true);
$graph->SetScale("textlin");
$graph->img->SetMargin(30, 30, 30, 30);
$ydata = array(10, 4, 7, 9, 1, 3);
$barplot = new BarPlot($ydata);
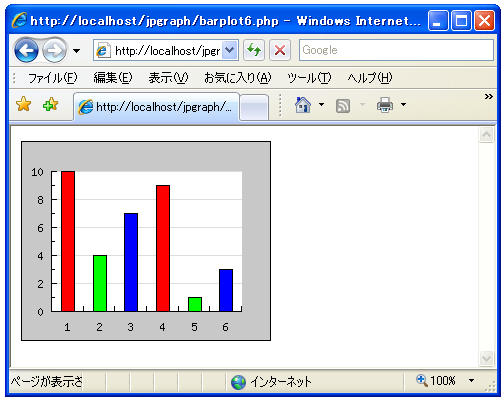
$barplot->SetFillColor(array("red", "green", "blue"));
$graph->Add($barplot);
$graph->Stroke();
?>
上記のPHPファイルをブラウザで開いてみます。ブラウザには次のように表示されます。
( Written by Tatsuo Ikura )