- Home ›
- JpGraphを使ったグラフの描画 ›
- 棒グラフ(BarPlot) ›
- HERE
棒の横幅の設定
棒グラフとして表示される1つ1つの棒の横幅を設定します。横幅を設定するにはBarPlotクラスで用意されている「SetWidth」メソッドを使います。
SetWidth
function SetWidth($aFractionWidth)
Specify width as fractions of the major step size

Parameter:
  $aFractionWidth  Width in fractions
引数に0から1.0までの数値を指定します。この数値は1つの棒が表示可能な最大幅を1.0として横幅を最大値の何%にするかを指定します。例えば最大幅の60%にしたいのであれば「0.6」を引数に指定します。
例えば次のような記述となります。
$ydata1 = array(10, 4, 7, 9, 2, 3);

$barplot1 = new BarPlot($ydata1);
$barplot1->SetWidth(0.6);

$graph = new Graph(250, 200);

$graph->Add($barplot1);
サンプル
それでは実際に試して見ます。
<?php
include ("jpgraph/jpgraph.php");
include ("jpgraph/jpgraph_bar.php");
$graph = new Graph(250, 200, "auto");
$graph->SetFrame(true);
$graph->SetScale("textlin");
$graph->img->SetMargin(30, 30, 30, 30);
$ydata = array(10, 4, 7, 9, 1, 3);
$barplot = new BarPlot($ydata);
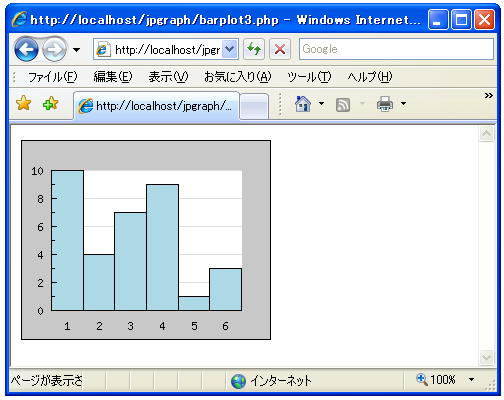
$barplot->SetWidth(1.0);
$graph->Add($barplot);
$graph->Stroke();
?>
上記のPHPファイルをブラウザで開いてみます。ブラウザには次のように表示されます。
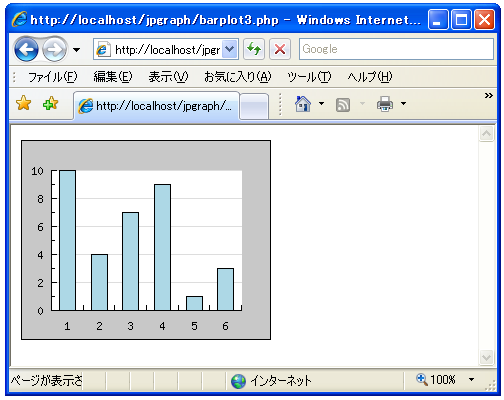
棒の横幅を最大にしてみました。先ほどのサンプルで「SetWidth」メソッドの引数を「1.0」から「0.5」にすると次のようになります。
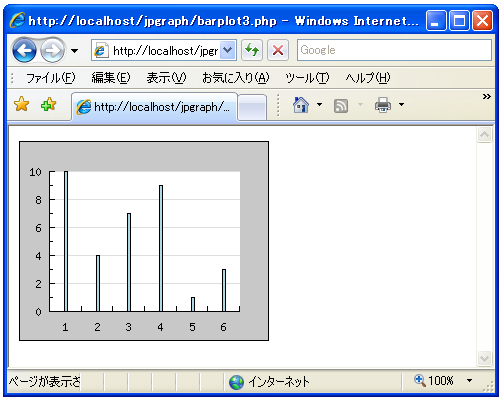
また「SetWidth」メソッドの引数を「0.1」にすると次のようになります。
複数の棒グラフを表示している場合の横幅の設定
GroupBarPlotクラスを使って複数の棒グラフを表示している場合、元になっているBarPlotクラスのオブジェクトに対して「SetWidth」メソッドを遣って横幅を設定しても無視されます。
複数の棒グラフを表示している場合は個々の棒グラフに対して幅を設定するのではなくGroupBarPlotクラスのオブジェクトに対して「SetWidth」メソッドを使って横幅を設定します。GroupBarPlotクラスはBarPlotクラスのサブクラスでありBarPlotクラスで定義されている「SetWidth」メソッドを使うことが出来ます。
例えば次のような記述となります。
$ydata1 = array(10, 4, 7, 9, 2, 3);
$ydata2 = array(5, 12, 3, 8, 5, 9);

$barplot1 = new BarPlot($ydata1);
$barplot2 = new BarPlot($ydata2);

$groupbarplot = new GroupBarPlot(array($barplot1,$barplot2));
$groupbarplot->SetWidth(0.8);

$graph = new Graph(250, 200);

$graph->Add($groupbarplot);
この場合、複数ある棒グラフの横幅を合計した幅が、最大値の何%に設定するかを指定します。1つ1つの棒グラフの横幅は同じになります。
それでは実際に試して見ます。
<?php

include ("jpgraph/jpgraph.php");
include ("jpgraph/jpgraph_bar.php");

$graph = new Graph(250, 200, "auto");
$graph->SetFrame(true);
$graph->SetScale("textlin");

$graph->img->SetMargin(30, 30, 30, 30);

$ydata1 = array(10, 4, 7, 9, 1, 3);
$ydata2 = array(5, 12, 3, 8, 5, 9);

$barplot1 = new BarPlot($ydata1);
$barplot2 = new BarPlot($ydata2);

$groupbarplot = new GroupBarPlot(array($barplot1,$barplot2));
$groupbarplot->SetWidth(0.9);

$graph->Add($groupbarplot);

$graph->Stroke();
?>
上記のPHPファイルをブラウザで開いてみます。ブラウザには次のように表示されます。
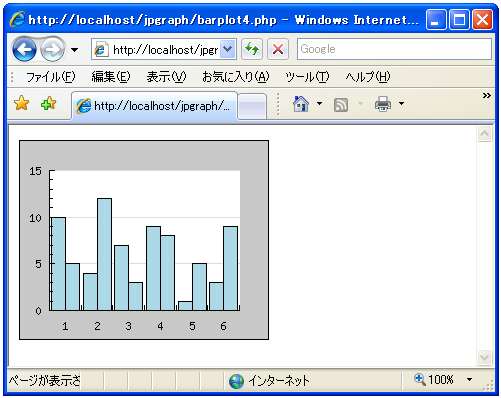
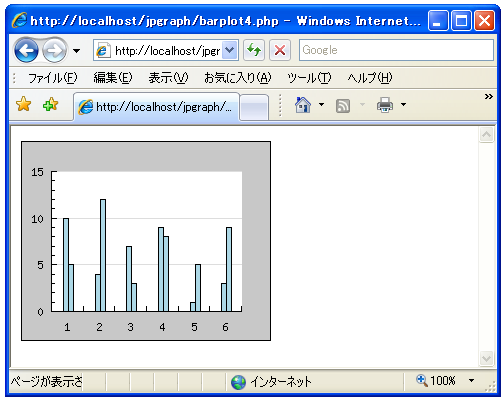
また「SetWidth」メソッドの引数を「0.3」にすると次のようになります。
( Written by Tatsuo Ikura )