- Home ›
- JpGraphを使ったグラフの描画 ›
- 棒グラフ(BarPlot) ›
- HERE
複数の棒グラフを表示する(GroupBarPlotクラス)
広告
1つのグラフ上で複数の棒グラフを同時に表示することが出来ます。
線グラフの場合は必要なだけの線グラフを作成しGraphクラスのオブジェクトに追加するだけでよかったのですが、棒グラフの場合は必要なだけのBarPlotクラスのオブジェクトを作成しグループ化した後でGraphクラスのオブジェクトに追加します。単に複数のBarPlotクラスのオブジェクトを追加した場合は重なって表示されてしまいますので注意して下さい。
複数の棒グラフをグループ化するにはGroupBarPlotクラスのオブジェクトを使います。GroupBarPlotクラスは「jpgraph_bar.php」内で定義されています。
CLASS GroupBarPlot EXTENDS BarPlot
GroupBarPlotクラスはBarPlotクラスのサブクラスです。
コンストラクタは次のようになっています。
GroupBarPlot
function GroupBarPlot($plots)
Create a new Group bar plot

Parameter:
  $plots  Array of individual plots
並べて表示したい棒グラフのオブジェクトを先に作成しておき、そのオブジェクトを配列にしたものを引数としてコンストラクタに渡してGroupBarPlotクラスのオブジェクトを作成します。そしてグラフには個々の棒グラフを追加するのではなくGroupBarPlotクラスのオブジェクトを追加します。
例えば2本の棒グラフを表示する場合は次のような記述となります。
$ydata1 = array(10, 4, 7, 9, 2, 3);
$ydata2 = array(5, 12, 3, 8, 5, 9);

$barplot1 = new BarPlot($ydata1);
$barplot2 = new BarPlot($ydata2);

$groupbarplot = new GroupBarPlot(array($barplot1,$barplot2));

$graph = new Graph(250, 200);

$graph->Add($groupbarplot);
サンプル
それでは実際に試して見ます。
<?php

include ("jpgraph/jpgraph.php");
include ("jpgraph/jpgraph_bar.php");

$graph = new Graph(250, 200, "auto");
$graph->SetFrame(true);
$graph->SetScale("textlin");

$graph->img->SetMargin(30, 30, 30, 30);

$ydata1 = array(10, 4, 7, 9, 1, 3);
$ydata2 = array(5, 12, 3, 8, 5, 9);

$barplot1 = new BarPlot($ydata1);
$barplot2 = new BarPlot($ydata2);

$groupbarplot = new GroupBarPlot(array($barplot1,$barplot2));

$graph->Add($groupbarplot);

$graph->Stroke();
?>
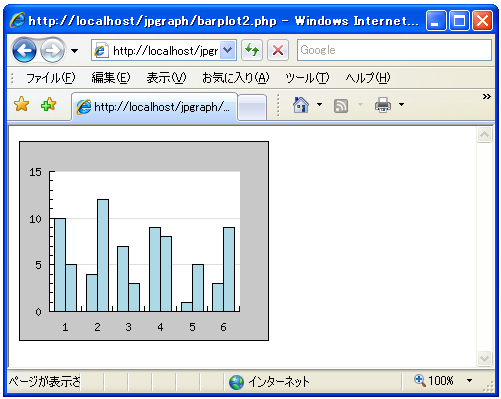
上記のPHPファイルをブラウザで開いてみます。ブラウザには次のように表示されます。
( Written by Tatsuo Ikura )